Too Good To Go Blog
What Retail Foot Traffic Data Reveals About the Modern Shopper
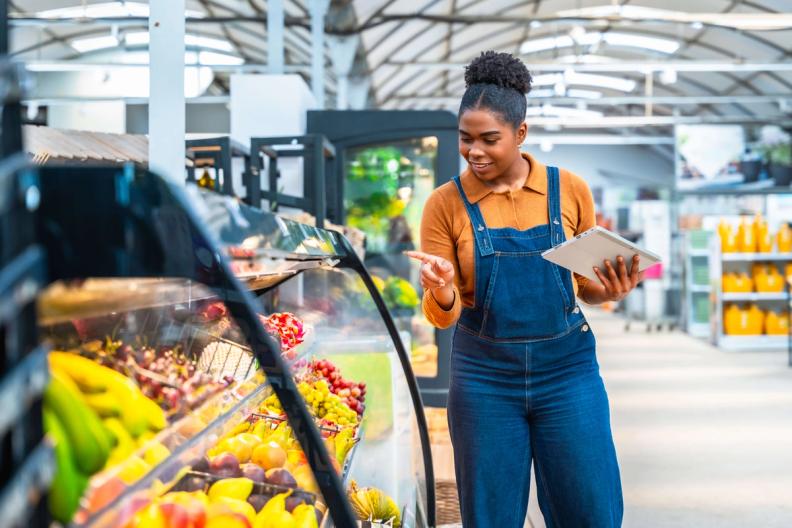
Grocery chain managers are spending more time staring at dashboards than walking their aisles. The numbers tell a story, but not always the one you expect. While traditional metrics track who walks through your doors, modern foot traffic data reveals something deeper: how shopping behavior has fundamentally shifted and what that means for your revenue per square foot.
In this article, we will walk you through what retail foot traffic data can reveal about modern food retail customers. From the deal-seekers reshaping visit frequency to the discovery shoppers driving impulse purchases, you will learn how to read beyond the surface metrics and spot the patterns that can inform everything from inventory decisions to customer acquisition strategies.
Modern Shoppers Are Rewriting the Rules of Frequency
The weekly grocery trip is not dead, but it is no longer the only story your foot traffic data tells. According to Innova Market Insights, 66% of US consumers shop for groceries in-store at least once a week while also engaging across multiple channels. The multi-channel engagement matters more than most grocery chain managers realize.
What foot traffic data reveals is that modern shoppers are splitting their needs across different types of visits. The big weekly haul still happens, but it is now supplemented by smaller, more targeted trips. A customer might hit your store on Sunday for the family groceries, then return Wednesday for fresh produce, and swing by Friday for a quick dinner solution.
Shopping patterns show up clearly in the data when you track visit frequency alongside basket composition. Convenience store operators see this most clearly. The same customer who buys coffee every morning might return that evening for a completely different set of items. Foot traffic data reveals how shopping has become more fluid and purpose-driven beyond simple visit counts. Understanding that fluidity is the first step toward designing a store experience that meets customers wherever they are in their week.
Deal-Seeking Behavior Is Driving Traffic Patterns
Price consciousness has expanded beyond product selection to influence shopping timing and location choices. Grocery chain managers are seeing customers time their visits around weekly ads, promotional periods, and markdown schedules, and the data backs it up.
According to Placer.ai, discount and dollar stores saw 2.8% year-over-year growth in foot traffic in 2024 as consumers prioritized value amid economic uncertainty, and that price-driven behavior extends well beyond discount retailers.
Your foot traffic data can reveal these patterns when you layer visit timing with promotional calendars. Customers who show up consistently on the same day each week might be following your ad cycle. Those who visit during specific hours could be targeting markdown times for bakery items or prepared foods. Understanding these patterns helps you optimize both staffing and inventory to capture more of this deal-driven traffic.
The key insight is that customers are strategically timing their visits to maximize value. That strategic behavior creates predictable patterns in your foot traffic data that you can leverage for better business outcomes.
Discovery Shopping Is Creating New Visit Types
While some customers are becoming more deliberate about timing, others are embracing spontaneity in ways that reshape foot traffic patterns. Research from Capital One Shopping shows that impulse buying accounts for up to 62% of grocery sales revenue, with many purchases happening spontaneously during shopping trips.
Discovery-driven shopping creates a different type of foot traffic altogether, with shorter visits and higher per-minute spend. Bakery owners see this when customers stop in for coffee and leave with pastries they had not planned to buy. Convenience store operators notice it in the evening rush when customers grab dinner items alongside their planned purchases.
What makes this traffic pattern valuable is its responsiveness. Unlike deal-seekers who follow promotional calendars, discovery shoppers respond to in-the-moment factors like new product displays. Your foot traffic data might show these visits as shorter in duration but higher in conversion rates, which tells a very different story than raw visit counts alone.
Cafe operators particularly benefit from understanding this pattern. A customer who discovers your location through a breakfast visit might return for lunch, then dinner, then weekend coffee. Each visit is driven by positive surprise rather than routine planning. Surplus food apps like Too Good To Go tap directly into this behavior, connecting deal-seeking customers with stores they may never have visited otherwise and turning surplus inventory into a natural entry point for discovery.
Omnichannel Behavior Is Blurring Traffic Attribution
The most complex story your foot traffic data tells involves customers who interact with your business across multiple touchpoints before walking through your doors. Grocery Doppio's analysis of 2024 digital grocery trends found that omnichannel shoppers spend 1.5x more monthly than single-channel shoppers, driving loyalty and higher basket sizes.
This behavior creates attribution challenges that many food retail operators underestimate. A customer might research your weekly ad online and check product availability through your app before ever walking through the door. Your foot traffic data captures the final step, but the customer journey started much earlier through digital channels.
Quick-service restaurant franchisees see this most clearly with mobile ordering. Foot traffic data shows a customer visit, but that visit was preceded by app engagement and payment processing before the customer even left home. The physical visit is just one part of a longer interaction, and treating it as the whole story leads to incomplete conclusions.
Connecting your foot traffic patterns to your broader customer engagement metrics is where the real insight lives. A decline in walk-in traffic might be offset by an increase in pickup visits driven by online ordering. A spike in evening traffic could correlate with lunchtime app usage. Understanding omnichannel behavior helps you interpret what the data is telling you.
Turning Foot Traffic Insights Into Growth
Modern shoppers are more complex and more strategic than any single metric can capture. The deal-seeker following your ad cycle and the discovery shopper responding to an in-store moment are both showing up in your foot traffic data, and so is the omnichannel customer whose journey started on their phone long before they walked through your doors. Knowing how to tell them apart is what turns that data into something useful.
For food retail operators looking to put those insights to work, Too Good To Go offers a practical starting point. By connecting value-driven customers with surplus food they would not have found otherwise, it creates new visit occasions that show up directly in your traffic numbers. Every bag rescued is a customer introduced, and often one who comes back. Learn more about how Too Good To Go can help reduce food waste while bringing new customers through your door.
Frequently Asked Questions
What metrics should I track beyond basic foot traffic counts?
Focus on visit frequency patterns, duration per visit, basket composition changes, and the correlation between promotional periods and traffic spikes. These metrics reveal customer behavior patterns rather than just volume, giving you a far more complete picture of how your store is performing.
How can I identify deal-seeking customers in my foot traffic data?
Look for customers who visit consistently during promotional periods, show up on specific days that align with your ad calendar, or cluster their visits around markdown times for prepared foods and bakery items. When those patterns repeat week over week, you are likely looking at deal-driven behavior.
What does discovery shopping behavior look like in foot traffic analytics?
Discovery shoppers typically show shorter visit durations but higher conversion rates and per-minute spend. They are less predictable in timing but more likely to make unplanned purchases once in store, which makes them valuable even when they do not show up as frequent visitors in the raw data.
How do omnichannel customers affect foot traffic interpretation?
Omnichannel customers may show declining walk-in traffic but increased pickup visits driven by online ordering. Their foot traffic data needs to be viewed alongside digital engagement metrics to understand the full customer journey, otherwise you risk misreading what is causing shifts in in-store volume.
Can surplus food programs really impact foot traffic patterns?
Yes. Programs like Too Good To Go create new visit types where customers come specifically for surplus items but often add regular purchases. This creates measurable increases in both new customer acquisition and basket size during pickup visits, making surplus food a genuine traffic driver rather than just a waste reduction tool.
How often should I analyze foot traffic data for actionable insights?
Weekly analysis helps you spot promotional impacts and seasonal patterns, while monthly reviews reveal longer-term behavior shifts and the effectiveness of customer acquisition strategies. The two timeframes complement each other well and together give you both the tactical and the strategic picture.
start saving food today
Our app is the world's largest marketplace for surplus food. We help users rescue good food from going to waste, offering great value for money at local stores, cafes and restaurants.
Too good to go blog
Too Good To Go BlogMenu Engineering for Restaurants: How to Design a Menu That Reduces Waste
October 19, 2026
Your menu is one of the most powerful tools in your restaurant, and it's probably working harder than you realize. Beyond setting the tone for your guests' e...
Too Good To Go BlogGrocery Store Promotions That Pay Off: Timing, Tactics, and Traffic
October 13, 2026
Grocery store promotions are one of the most common tools operators use to drive traffic and move inventory. However, they are also one of the easiest ways t...
Too Good To Go BlogInside the Numbers: What Too Good To Go Partners Are Recovering
September 29, 2026
Every food business that prepares fresh product has to commit to inventory before it knows what will sell, which means the volume on the shelf at 10 a.m. ref...

Too Good To Go BlogPantry Organization Tips That Help You Waste Less Food
September 21, 2026
Most of the food that gets wasted at home was bought with good intentions. A bag of lentils slides behind a cereal box, a second jar of peanut butter joins t...